Role of MRI in Breast Screening of Women with high risk of Breast Cancer

Breast cancer is the most common type of cancer in the United Kingdom. Usually a lump or thickened breast tissue is the first noticeable symptom, although most breast lumps are not cancerous. The risk of developing breast cancer increases with age and early detection increases the chance of survival.

Symptoms could include:

  • New lump or area of thickened tissue on either breast
  • Change in size or shape of one or both breast
  • Bloody discharge from nipples
  • Lump or swelling on either armpits
  • Rash around the nipple
  • Change in the appearance of nipple

Men can also get breast cancer although it is very rare. In UK, about 62,000 people are diagnosed with breast cancer each year and it includes 370 men.

Symptoms of male breast cancer include:

  • Nipple discharge without squeezing, often blood stained
  • Inverted nipple
  • Sores on the chest or nipple area
  • Swelling of chest area and lymph nodes under arm

Family history plays a big factor in the likelihood of an individual in developing breast cancer. Particular genes known as BRCA1 and BRCA2 can increase risk of developing both breast and ovarian cancer.

The National Institute for Health and Care Excellence (NICE, 2013) recommends to offer mammographic surveillance annually to women aged 50 to 69 with personal history of breast cancer and are still at high risk of breast cancer and does not have TP53 mutation. And to offer MRI surveillance annually to women aged 30-49 years who has personal history of breast cancer still at risk of breast cancer.

Modalities used for breast screening includes mammography, breast ultrasonography, MRI, and clinical breast examination.

Mammography is performed for early detection of breast cancer using low dose radiation.

MRI of Breast

MRI is considered to be important diagnostic tool in detection, evaluation, treatment planning and therapy follow up of breast cancer (Mankad et al., 2011).

t2 paint

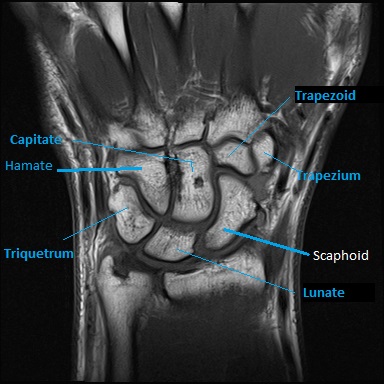
Fig 1. T2 weighted image of Breast in Axial Plane

The above image (fig 1) demonstrates anatomy of the breasts in axial plane. In order to obtain this image within optimal time-frames, parallel imaging technique (GRAPPA – Siemens) was used. This method uses multichannel coils which are coupled and works together in order to fill more lines of the K –space per given TR (Westbrook, Roth and Talbot, 2011). Each coil has its own sensitivity profile which enables to establish location of the signal depending on its amplitude and following that image is obtained or reconstructed by using algorithms (Westbrook, Roth and Talbot, 2011). The image (fig 1) was obtained in axial plane because it is considered to be more optimal comparing to sagittal plane, since reconstruction algorithms are less sensitive to movement artefacts at this instance (Thomassin-Naggara et al., 2012). T2 –weighting was used because according to the same author, it is very helpful in evaluation of cystic masses, whereas Monticciolo (2011) considers T2 weighting to be useful in detection of skin edema as sign of lymphatic obstruction. This image benefited from using T2 –weighting without application of fat saturation because according to Thomassin-Naggara et al., (2012) T2 non-fat saturated images are more informative in prediction of benign nature of cystic lesion if detected.

t1paint

Fig 2. T1W

The image above (Fig 2) is T1 weighted sequence taken in axial plane. T1 is useful in detection of presence of fatty component within a lesion, which also a plays major aspect in predicting its benign nature, therefore it is done without fat saturation. T1 also allows metal markers which may have been positioned at end of biopsy to be detected (Thomassin-Nagarra et al., 2012). The same author also states that phase encoding direction for all axial plane should be right to left and for sagittal or coronal plane, the direction is anterior-posterior, to limit artefacts repeating respiratory and cardiac movement.

The patient is positioned prone with arms above head, this will limit artefacts related to phase encoding and aliasing artefact. Yeh et al.,(2014) states that positioning a patient for breast MR is technically more difficult than positioning for MR scan of different body part.

It is essential to position patient on MRI coil correctly to limit certain numbers of artefact (Thomassin-Naggara et al., 2012) as shown on table 1. Imaging efficiency and accuracy will improve in cancer detection when artefacts due to improper positioning are eliminated (Yeh et al., 2014).

Main Artefacts Signs Solution
Movement artefact Fuzzy lines

Propagation in the phase encoding direction Enhancement on subtracted sequences not found on native sequences

Comfortable position for the patient

Foam wedged in the coil to wedge small breast

Aliasing artefact Ghost image Increase the FOV

Modify the phase encoding direction

Magnetic Susceptibility artefact Tissue distortion

Hypersignal spots

Fall in signal

Reduce the TE
Non uniformity artefact of fat saturation Occurs with a non-uniform field because of non-selection of fatty pixels Reshim the magnet

Table 1 shows the main artefact and solution (Thomassin-Naggara et al., 2012)

In the journal of Kriege et al., (2004) they screened 1909 women which includes 358 carriers of germ line mutation. Table 2 shows the result of the study.

Sensitivity Specificity
Clinical Breast Examination 17.9 98.1
Mammogram 33.3 95.0
MRI 79.5 89.8

They have compared MRI and mammography in screening women to determine whether MRI screening facilitates early diagnosis of hereditary breast cancer as MRI may improve sensitivity of screening in women with genetic predisposition to breast cancer. The study concluded that with the screening program used, MRI especially, showed more sensitivity than mammography or CBE, and can detect and breast cancer in women at early stage of risk of breast cancer, and contributed to early detection of hereditary breast cancer. However, MRI screening drawback is that its specificity is lower than mammography.

Kuhl (2004) stated that MRI seemed to be equivalent to mammography and more accurate in early familial breast cancer diagnosis. Although apart from MRI being costly, it is not eagerly accepted as screening modality for the reason of it having reported low specificity and PPV.

In the study of Warner et al., (2005) MRI, US, Mammography and CBE were performed on the same day to 236 women who were carriers of either BRCA1 or BRCA2 aged 25 to 65. 55% of women were menopausal, 30% had history of breast cancer and 9% ovarian cancer. They concluded that MRI is more sensitive for detecting breast cancers in BRCA1 and BRCA2 carriers than mammography, ultrasound and CBE alone.

Leach et al., (2005) performed a prospective cohort study participated by 649 women aged 35 to 49 with strong family history of breast or high probability mutation of BRCA1 or BRCA2 or TP3 mutation. 35 out of the 649 women screened with both mammogram and CE MRI were diagnosed with cancer, CE MRI only diagnosed 19 patients and 6 by mammography only.

Sensitivity Specificity
Contrast Enhanced MRI 77% 81%
Mammography 40% 93%
Both modality 94% 77%

Table 3 showed result of sensitivity and specificity of their study. They stated that it would benefit carriers of BRCA1 germline mutation with contrast enhanced MRI screening and combination of CE MRI and mammography will provide most effective screening examination for BRCA1, BRCA2.

This is the same with the study of Warner et al., (2008) that concluded on their study that using both MRI and mammography in screening might rule out cancerous lesions than mammography alone in women with likely inherited predisposition to breast cancer. Annual MRI and mammography screening using BI-RADS score of 4 or 5 to define positivity is accurate means in screening women with strong generic predisposition to breast cancer.

Salem et al., (2013) stated on their review article that MRI is used mostly in diagnosis and staging of breast cancer rather than in screening.

Summary

MRI showed more sensitivity than mammography in the detection of malignancy in fibroglandular or dense tissue. But as reported in the study of Leach (2005), mammography has higher specificity and combination of both mammography and CE MRI has higher sensitivity but also results to loss of specificity. Salem et al., (2013) stated that MRI might seem to be a logical choice for screening breast cancer due to its impressive ability to detect tumours not found on mammograms. However, the same authors (Salem et al.,) also said on their review article that while MRI is more sensitive than mammography, it has higher false positive rate that could result to adverse physiological effects and lead to unnecessary biopsy and screening on the women screened. There are also factors to consider such as cost effectiveness and patients with claustrophobia and devices that are not conditional or compatible with MRI.

References

Kriege, M., Brekelmans, C., Boetes, C., Besnard, P., Zonderland, H., Obdeijn, I., Manoliu, R., Kok, T., Peterse, H., Tilanus-Linthorst, M., Muller, S., Meijer, S., Oosterwijk, J., Beex, L., Tollenar, R., Koning, H., Rutgers, E. and Klijn, J. (2004) Efficacy of Mri and Mammography For Breast-cancer Screening in Women with a Familial Or Genetic Predisposition. The New England Hournal of Medicine [online]. 351 (5), pp. 427-437. [Accessed 30 March 2019].

Kuhl, C. (2004) Screening of Women with Hereditary Risk of Breast Cancer. Clinical Breast Cancer [online]. 5 (4), pp. 269-271. [Accessed 28 March 2019].

Leach, M.O., Boggis, C.R., Dixon, A.K., Easton, D.F., Eeles, R.A., Evans, D.G., Gilbert, F.J., Griebsch, I., Hoff, R.J., Kessar, P., Lakhani, S.R., Moss, S.M., Nerurkar, A., Padhani, A.R., Pointon, L.J., Thompson, D., Warren, R.M. and , (2005) Screening with Magnetic Resonance Imaging and Mammography of a Uk Population at High Familial Risk of Breast Ca: A Prospective Multicentre Cohort Study (Maribs). The Lancet [online]. 365 (9473), pp. 1769-1778. [Accessed 28 March 2019].

Mankad, K., Hoey, E., Lakkaraju, A., and Bhuskute, N., 2011. MRI of the whole body. An illustrated guide to common pathologies. London: Hodder Arnold.

Monticciolo, D. L., 2011. Magnetic Resonance Imaging of the breast for cancer diagnosis and staging. Seminars in Ultrasound CT and MRI [online]. 32 (4), pp. 319-330. [Accesses 28 March 2019].

Salem, D., Kamal, R., Mansour, S., Salah, L. and Wessam, R. (2013) Breast Imaging in the Young: The Role of Magnetic Resonance Imaging in Breast Cancer Screening, Diagnosis and Follow Up. J Thorac Dis [online]. 5 (1), pp. 9-18. [Accessed 28 March 2019].

The National Institute for Health and Care Excellence, NICE (2013) Familial breast cancer: classification, care and managing breast cancer and related risks in people with a family history of breast cancer. Available from: https://www.nice.org.uk/guidance/cg164/chapter/Recommendations#surveillance-and-strategies-for-early-detection-of-breast-cancer [Accessed 29 March 2019].

Thomassin-naggara, I., Trop, I., Lalonde, L., David, J., Peloquin, L. and Chopier, J. (2012) Tips and Techniques in Breast Mri. Diagnostic and Interventional Imaging [online]. 93, pp. 828-839. [Accessed 28 March 2019].

Warner, E., Messersmith, H., Causer, P., Eisen, A., Shumak, R. and Plewes, D. (2008) Systematic Review: Using Magnetic Resonance Imaging to Screen Women at High Risk For Breast Cancer. Annals of Internal Medicine [online]. 148 (9), pp. 671-679. [Accessed 28 March 2019].

Warner, E., Plewes, D.B., Hill, K.A., Causer, P.A., Zubovits, J.T., Cutrara, M.R., Yaffe, M.J., Messner, S.J., Meschino, W.S., Piron, C.A. and Narod, S.A. (2005) Surveillance of Brca1 and Brca2 Mutation Carriers with Magnetic Resonance Imaging, Ultrasound, Mammography, and Clinical Breast Examination. Evidence Based Obstetrics and Gynecology [online]. 7 (2), pp. 100-102. [Accessed 29 March 2019].

Westbrook, C., Roth, C. K. and Talbot, J., 2011. MRI in practice.4th ed. Chichester: Wiley-Blackwell.

Yeh, E., Georgian-smith, D., Raza, S., Bussolari, L., Pawlisz-hoff, J. and Birdwell, R. (2014) Positioning in Breast Mr Imaging to Optimize Image Quality. Radiographics 2014 [online] 34 (1). Available from: https://doi.org/10.1148/rg.341125193 [Accessed 30 March 2019].
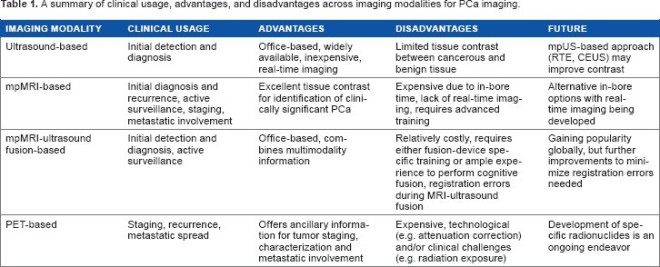
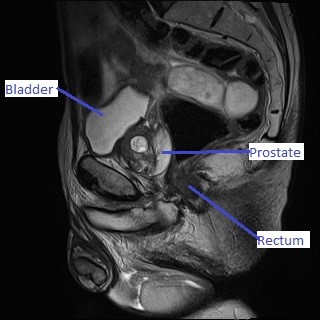
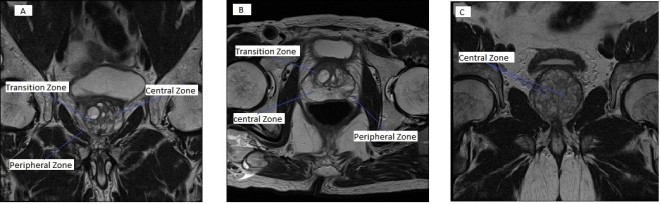
Prostate MRI and the difference between 1.5 Tesla and 3 Tesla Imaging

Prostate is a small gland about the size of a walnut that gets bigger as men get older. It is located below the bladder surrounding the first part of a tube called urethra that carries urine from bladder to penis.  The same tube carries semen.

Prostate Cancer is the most common type of cancer in men in the UK with 40,000 diagnosed new cases every year. The condition mainly affects men over the age of 50 and risk increases as they get older.

Symptoms include needing to pee frequently, difficulty in starting to pee, taking longer time or straining while peeing, blood in urine or in semen.

Prostate produces a protein called Prostate Specific Antigen (PSA). PSA leaks into the blood and can be measured on the PSA test. PSA level can be higher due to conditions such as benign prostatic hyperplasia (BPH) or prostatitis.  Raised PSA level may be a sign of prostate cancer.

Age Group Normal PSA Value (ng/ml)
50-60 years old        3
60-70 years old        4
70-80 years old        5

Table 1 shows the age specific value of normal PSA

Having a result of high value PSA does not confirm presence of tumour or abnormality but could be due to some factors like urinary tract infection, therefore further investigation is needed after.

Digital Rectal Examination. A doctor or a nurse inserts a finger using gloves in rectum to feel prostate. It could be uncomfortable to patient but it is a quick process and should be painless. Normal prostate will feel smooth and if cancer is present, it will feel hard, rough or bumpy.

Imaging modalities used to scan prostate are Transrectal Ultrasound, Computed Tomography, PET imaging, and MRI.

table 2

Table 2 shows the clinical usage, advantage and disadvantage of some of the imaging modalities for prostate (Sakdar and Das, 2016).

National Institute for Health and Care Excellence (2018) recommends to offer Multi parametric MRI as first line investigation for people who are suspected with localized prostate cancer. 5 point Likert scale to be used in reporting results.

MRI

MRI of the prostate gland is considered to be very effective and valuable diagnostic tool in detection of prostate cancer, staging of the disease and treatment planning (Li et al., 2013) Agha et al., (2014) states that MRI shows a clear delineation of the prostate and demonstrates internal zonal anatomy in high resolution quality.  This is the same in the research of Beyesdorff et al., (2004) that with excellent soft tissue differentiation in MRI, it provides images of prostate and surrounding structures in high resolution.

SAG 1.jpg

Fig 1. T2 weighted Sagittal image of male pelvis.

Sagittal plane used to obtain the above image (Fig 1) due to its ability to demonstrate pelvic organs lying in the midline (Westbrook, 2014). According to local protocols, T2 sagittal images of the pelvic organs with slice thickness of 4mm are the first series of images to obtain in order to plan next high resolution prostate series in coronal and axial planes. T2 weighted imaging is regarded to be optimal in showing anatomy of the prostate gland, and according to Puech et al., (2012) sagittal T2 HR images are useful in showing apex of the prostate and superior-inferior extent of prostatic lesions.

The use of saturation band to eliminate signal from anterior subcutaneous fat could be helpful in improving image in sagittal plane.

cor axial 2.jpg

Fig 2. Coronal (A)(C) and Axial (B) view in T2 high resolution images of the prostate showing   hypertrophy of the transition zone.

On the above image, Fig 2C, prostate is enlarged and observed hypertrophy of gland is due to an aging process. This prostate enlargement is considered to be benign since it involves central zone of the gland and benign prostatic hyperplasia (Mankad et al., 2011). In contrast, according to the same authors (Mankad et al., 2011) malignant lesions usually occupy peripheral zones of the gland.  Research findings from Villeirs et al., (2005) also agree with the above authors indicating that, most of the malignant lesions are located in the peripheral zone of prostate and they appeared as hypointense on T2 weighted images.  However, although obtained T2 high resolution images do deliver valuable diagnostic data, they are not considered to be specific in detection of the cancer without complimentary DWI and T1 contrast enhanced sequences, since prostatitis, scar tissue, and bleeding following biopsy can also bear the same T2 appearance as malignant lesions (Li et al., 2012; Villeirs et al., 2005).

dwi 3.jpg

Fig 3. Fig 3A DWI and Fig 3B ADC showed image from sequence with b value of 0, 100 and 800. Fig 3C with bValue of 1400

The above images (Fig 3) are DWI since obtained contrast depends on ability of molecules to diffuse or move in extracellular space (Westbrook, Roth and Talbot, 2011). In the case of prostate cancer, this movement would be restricted due to decrease in extracellular space resulted from high cellularity of the gland and decreased ductal morphology (Li et al., 2013). Image B (Fig3) demonstrate ADC map, where high signal in the central zone of prostate reflects free, non restricted diffusion of the water molecules.  Hyperintense appearance on ADC map means that voxels in imaging volume were assigned high values of signal intensity during post processing calculation (Westbrook, Roth and Talbot, 2011).

post gad 4.jpg

Fig 4. Dynamic contrast enhanced imaging A- pre contrast B – 75 seconds post contrast C- 3 minutes delayed contrast

Obtained images in Fig 4 are part of a series and demonstrates dynamics of prostate contrast enhancement. Due to high vascularity of the prostate, DCE is considered to be optimal method to highlight and differentiate extremely vascular tumours from less vascular healthy tissues comparing with just pre and post contrast method (Barentz et al., 2012).  From the obtained images, it is obvious to see the enhancement reached the late part of the series.

DCE used to obtain the above image (Fig 4) would have been especially beneficial in detection of malignancy in anterior part and the apex of the gland due to apparent difficulty in assessment of this part with the T2 weighted images (Puech et al., 2012). Moreover, Puech et al., (2012) consider DCE to be the only precise method in evaluation of prostate tumour recurrence following radiotherapy.  However, Barensz et al., (2012) argue that optimal prostate assessment is only possible multiparametrically.

All of the above images (Figures 1 to 4) are all obtained using a 1.5 Tesla machine with body phased array coil.

1.5 Tesla versus 3 Tesla in Prostate Imaging

In the review of Beyersdoff et al., (2004) Twenty four patients with prostate cancer undergo 1.5Tesla MRI using combined endorectal coil and body phased array coil, and 3.0Tesla MRI using torso phased array coil. 22 among those patients were scanned before undergoing radical prostatectomy. MRI was imaged on both 1.5T and 3.0T machine with T2 weighted images in axial and coronal plane and additional axial T1 weighted sequence for 1.5T.  Both machine had accuracy of 73% for local staging of prostate cancer. Unfortunately, endorectal coil compatible for clinical use at 3.0T were not available at the time of the study and part of the limitation of the study is the small amount of participants that went through both field strengths. Images using endorectal coil used in the 1.5 T did not give much artefacts than blurring and motion artefact in the 3T images due most likely using high echo train length. At the end of review, their results suggest that image quality obtained with 1.5T MRI of the prostate using endorectal coil is superior to 3T images. However, they mentioned that prototypes of endorectal coils in 3T in combination with high field strength will lead to improvement of 3T SNR.

Jurgen et al., (2009) showed on their article the advantage and disadvantage of using 3T MRI in imaging prostate cancer. 3T will have increased SNR two times higher than in 1.5T. Benefits will include shortened scan time and increase in spatial resolution to improve anatomical detail visualization. However, higher field strength could be a potential drawback as it includes radiofrequency power deposition quadrupling, increased difference in susceptibility, dielectic effect, and signal heterogeneity.  They have found no significant difference between 3T with torso phased array and 1.5 with endorectal coil image quality. They have concluded that image between 3T with phased array coil and 1.5T with endorectal coil are equal in quality, but preferred 3T with endorectal coil in local staging.

Monzen et al., (2012) compared on their study prostate cancer detection using external phased array coil on both 1.5T and 3T MRI.  Ramdomized 133 patient were divided into two groups where 66 patients were examined with 1.5T MRI and the remaining 67 patients with 3T MRI both using spine coil and flexible 6 channel coil. There were 33% in the 66 patient group who could be diagnosed with prostate cancer by both using the 1.5 T and biopsy, and 42% out of 67 with both 3T and biopsy. They found that sensitivity of T2, DWI and DCE in 3T is way better than that of 1.5T but specificity of T2 and DCE is worse.

The result will be the same in the study of Kitajima et al., (2010) that sensitivity, specificity of prostate cancer detection is better in 3T MRI when using T2, DWI and DCE on their study participated by 53 patients.

In the research article of Ryznarova et al., (2018) 103 patients with confirmed prostate from their biopsy were divided into three groups with two different types of protocol using either 1.5T or 3T MRI with surface array coils. First protocol included T1W, T2W, DWI, MRS and DCE sequences. Second protocol is using the same sequences but without the DCE. The first group used 1.5T scanner using first protocol with 41 patients. Second group with 30 patients used first protocol but with 3T MRI. The third group with 32 patients used second protocol but without the dynamic contrast examination. The result showed that in group A 27 out of 41 patients, 27 out of 30 patients in group B, and 23 out of 32 patients in group C were correctly staged.

Group A B C
Tumor localized inside prostate (T2 stage) 72% sensitivity       56% specificity 100% sensitivity       77% specificity 83% sensitivity       57% specificity
Extracapsular tumor extension (T3a) 50% sensitivity         83% specificity 70% sensitivity       100 % specificity 46% sensitivity       86% specificity
Seminal vesicle infiltration (T3b) 75% sensitivity       95% specificity 100% sensitivity       100% specificity 100% sensitivity       100% specificity
Overall accuracy in tumor stage prediction  

66%


90%


72%

Table 3 shows the comparison of the result of the three groups.

They found that adding dynamic contrast sequence into the 3T scanner protocol when used with phased array coil improved the overall accuracy in local tumor staging. Their comparison to other studies showed similar accuracy in extraprostatic extention. In conclusion, they found best accuracy in local prostate imaging using 3T MR scanner adding dynamic contrast in the protocol. Limitation of their study includes low number of patients with advanced stage cancer and different patients were scanned among the three groups in different scanner.

Summary

MRI is one of the best imaging modality for detection and staging prostate cancer.

The use of endorectal coil in cancer detection in imaging with 1.5T is preferable but may cause pian and discomfort to patients. 3T MRI could be superior in clinical test parameters but there are limitations to consider like safety on implant device. The sensitivity and specificity in 3T increase with the use of set protocols that includes T2W, DWI, and DCE imaging. Kitajima et al., (2010) states that it is expected that comparing with 1.5T MRI, 3T may have more advantage in detection of prostate cancer. Ryznarova et al., (2018) concluded on their study that patients examined on 3T MR scanner including DCE on the protocol provided the best accuracy of local prostate cancer staging. However, they have also noted that many centers uses 1.5T without ERC.

References

Agha, M. and Eid, A. (2015) 3 Tesla MRI Surface Coil: Is It Sensitive For Prostatic Imaging?. Alexandria Journal of Medicine [online]. 51 (2), pp. 111-119. [Accessed 11 March 2019].

Barentsz, J., Richenberg, R., Choyke, P., Verma, S., Villeirs, G., Rouviere, O., Logager, V. and Futterer, J., (2012). ESUR prostate MR guidelines 2012. European Journal of Radiology [e-journal] 22, pp. 746-757, [Accessed 14 March 2019].

Beyersdorff, D., Taymoorian, K., Knosel, T., Schnorr, D., Felix, R., Hamm, B. and Bruhn, H. (2005) Mri of Prostate Cancer at 1.5 and 3.0 T: Comparison of Image Quality in Tumor Detection and Staging. American Journal of Roentgenology [online]. 185 (5), pp. 1214-1220. [Accessed 12 March 2019].

Futterer, J. and Barentsz, J. (2009) 3t Mri of Prostate Cancer. Journal of Practical Medical Imaging and Management [online]. [Accessed 14 March 2019].

Kitajima, K., Kaji, Y., Fukabori, Y., Yoshida, K. and Suganuma, N. (2010) Prostate Cancer Detection with 3 T Mri: Comparison of Diffusion-weighted Imaging and Dynamic Contrast-enhanced Mri in Combination with T2-weighted Imaging. Journal of Magnetic Resonance Imaging [online]. 31 (3), pp. 625-631. [Accessed 14 March 2019].

Monzen, Y., Kurose, t, Okazaki, H., Mito, M., Wadasaki K, and Hiroshima, J. () Mri of Prostate Cancer at 1.5t and 3t Comparison of Image Quality in Tumor Detection. European Society of Radiology [online]., pp. 1-11. [Accessed 14 March 2019].

Puech, P., Iancu, A.S., Renard, B., Villers A. and Lemaitre, L., (2012). Detecting prostate cancer with MRI – why and how. [e-journal] 93, pp. 268-278. [Accessed 14 March 2019].

Ryznarova, Z., Dezortova, M., Jiru, F., Vik, V., Zachoval, R. and Hajek, M. (2018) Comparison of 1.5t and 3t Prostate Mr Examination Using Surface Array Coils in Routine Clinical Practice. Journal of Diagnostic Techniques & Biomedical Analysis [online]. 7 (2) [Accessed 11 March 2019].

Sarkar, S. and Das, S. (2016) A Review of Imaging Methods For Prostate Cancer Detection. Biomedical Engineering and Computational Biology [online]. 7 (1), pp. 1-15. [Accessed 14 March 2019].

Westbrook, C. (2014). Handbook of MRI technique. 4th ed.Chichester:Wiley-Blackwell.

Westbrook, C., Roth, C. K. and Talbot, J. (2011). MRI in practice.4th ed. Chichester: Wiley-Blackwell.


Endometrial Cancer Imaging

Imaging of Endometrial Cancer

Endometrium is the inner lining of the uterus playing key roles during menstrual cycle and during pregnancy. It is a pear shaped organ that houses a developing baby.

Endometrial cancer is a type of cancer that begins in the uterus. It is considered to be the most common female pelvis malignancy, it involves endometrium, inner layer of the uterus and has tendency to spread to myometrium and cervix (Mankad et al., 2011). It is most common in women who have been through the menopause.

Symptoms include vaginal bleeding after menopause, abnormal bleeding like heavy periods or in between periods, pelvic pain.

Imaging.

Ultrasound

Transvaginal ultrasound (TVUS) is often the first imaging modality used in the initial evaluation in women with post menopausal bleeding because it is inexpensive, quicker and does not involve ionizing radiation. In the article of Lancet (2010), it states that according to the data from United Kingdom Collaborative of Ovarian Cancer Screening , TVUS is effective for screening endometrial cancer among postmenopausal women. The test result has sensitivity and specificity between 80% and 90%. This data was participated by 48,230 post menopausal women who underwent the TVUS.

Optimum Endometrial Thickness cut off for Endometrial cancer Sensitivity Specificity
5.15mm 80.5% 86.2%
5mm 80.5% 85.7%
5mm plus endometrial abnormalities 85.3% 80.4%
Atleast 10mm 54.1% 97.2%

Table 1. shows sensitivity and specificity in relation to endometrial thickness cut off. Source: Lancet, J. (2010) Endometrial cancer detected with transvaginal ultrasound in postmenopausal women.

Computed Tomography

Recommendations for cross-sectional imaging in cancer management (2014) states that CT has limited value for local staging but is recommended for metastatic disease evaluation in the abdomen in cases of unfavourable histology such as serous papillary and clear cell carcinoma or high grade uterine sarcomas. In the journal of Faria et al., (2015)  due to CT having poor soft tissue differentiation, it limits its use in Endometrial Cancer staging. Compared to MRI, Ct is less sensitive and less specific in visualizing the myometrial invasion and cervical involvement accurately. This is supported in the journal of Yin Lin et al., (2018) that says CT is less helpful the investigation of abnormalities within the uterus, however, CT has better multiplanar spatial resolution that is useful in visualizing the whole pelvic and abdominal cavity showing enlarged nodes and gross soft tissue masses, and includes distant metastases in the lungs.

Magnetic Resonance Imaging

MRI plays important part in diagnosis, staging, therapy planning and treatment follow up of gynaecological malignancies (Punwani, 2011).

This image of female pelvis (Figure 1) was obtained in sagittal plane to show pelvic anatomy and plan subsequent high resolution sequences in axial oblique plane and coronal plane.

Fig 1Pelvis SAG

This image below (Figure 2) demonstrates malignant endometrial lesion in short axis axial plane. According to Mankad et al., (2011) endometrial lesions returns intermediate signal on T2 weighted images in contrast to high signal obtained from normal endometrial tissue, whereas, normal myometrium should be visualized as intermediate intensity structure. Between both layers, there is a junction zone which normally is hypo intense. This difference in normal appearance is due to histological composition of the layers where myometrium consists of smooth muscle fiber different to normal endometrium consisting of columnar epithelium and containing tubular glands secreting mucus (Waught and Grant, 2006).  Therefore, normal endometrium has more mobile hydrogen protons which return high signal on T2 and appears to be hyper intense. Nalaboff et al., (2001) states that The MR imaging appearance of a normal endometrium is demonstrated best on T2 weighted images due to the uterus has homogenous intermediate signal on T1 weighted sequences.

Fig 2Pelvis AX

Fig 3APevis 2Fig 3B

The above Images were obtained as part of Dynamic Contrast Enhanced T1 sequence which is considered to be useful in providing additional diagnostic data on malignancy localisation and also prognosis of the disease following radiotherapy (Punwani, 2011). Due to complex hispological structure of the uterine wall, appearance and pattern of enhancement of uterine lesions might be confusing. According to Mankad et al., (2011) endometrial tumour does not enhance as much as normal tissue. Punwani (2011) also confirms and specifies, that different to normal myometrium, endometrial lesions enhance slowly and less intensively. This is the same with Nalaboff et al., (2001) that says T1 weighted gadolinium enhanced MR imaging is helpful in demonstrating myometrial invasion because a carcinoma will enhance less than normal endometrium. On the other hand, Sala et al., (2010) consider that endometrial lesion enhances more rapidly comparing to normal endometrium. On the image obtained (Figure 3B), it is possible to differentiate hyperintense normal myometrium from intermediate intensity endometrial lesion and evaluate its invasion into myometrium.

DWI

In the review of Meissnitzer and Forstner (2016), Diffussion weighted imaging gives valuable information for the detection and differentiation of tumour from benign lesions. The planning should follow or be the same as the T2 weighted imaging.  DWI can detect lymph nodes but does not distinguish between benign and malignant lymph nodes. Optimal high b values varies from machine field strength and vendor, but should have 800 mm/s or more and is optimal when urinary bladder fluid appears dark. Haldorsen et al., (2016) states that the reported diagnostic performance of DW MRI for the endometrial cancer preoperative staging is in the range of those reported for contrast enhanced MR and contrast MR could be omitted when DWI sequence is included when patients has contraindications with the MR contrast agents.

Table 2 below shows the values of accuracy, sensitivity and specificity of MRI sequence. This table shows MRI has very high values and is better in clinical assessment of cervical invasion.

MRI Sequence Diagnostic accuracy Of MRI imaging in assessment of cervical invasion Sensitivity Specificity
T2 weighted imaging 90% 100% 87%
Post contrast T1 weighted imaging 96% 100% 95%
Dynamic MRI 100% 100% 100%

Table 2. Source: Faria et al., (2015) Imaging in endometrial carcinoma.

The study of Rahmani, M., et al (2018) showed that the MR contrast enhanced imaging of deep myometrial invasion showed 90.9% sensitivity, 91.8% specificity and 91.6% diagnostic accuracy.

Contrast Enhanced MRI for detection of: Accuracy Sensitivity Specificity
Deep myometrial invasion 58-100% 33-100% 44-100%
Cervical stroma invasion 46-89% 33-69% 82-96%
Metastatic lymph nodes 83-93% 17-80% 88-100%

Table 3. Source: Haldorsen et al., (2016)

However, Table 3 Illustrates that although MRI is considered best in staging preoperative endometrial cancer, contrast enhanced MRI is still variable (Haldorsen et al., 2016), showing different outcome from the study of Rahmani, M. et al. (2018)

Summary

TVUS has limitations with it being operator dependent and having limited field of view. There is no sufficient data about the predicting value of TVUS in cervical extention, parametrial invasion or lymphadenopathy (Faria et al., 2015)

MRI is better modality in clinical assessment and can assist in treatment planning. It is currently the most used modality for pre operative staging. With the DWI sequence on the MRI protocol, it can be used as replacement  to contrast when contra indicated in pre operative staging. However as TVUS is more cost effective than the MRI and more available and easily performed, when performed by an experienced operator, TVUS may accurately evaluate depth of myometrial invasion (Rahmani, et al., 2018). CT on the other hand, has limited value in accurate assessment of myometrial invasion due to its low contrast resolution. It is excellent in follow up of distant metastatic disease and nodal disease, and mainly used to assess advanced disease. With the use of contrast injection, it may be used to stage endometrial carcinoma when MRI is contra indicated.


References

Faria, S., Sagebiel T., Balachandran A., Devine C., Lal C., Bhosale, R. (2015) Imaging in endometrial carcinoma. Indian Journal of Radiology and Imaging. [online] pp 137-147. [Accessed 26 February 2019]

Haldorsen, I., Salvesen H. (2016) What Is The Best Preoperative Imaging for Endometrial Cancer? [Online] Available from: https://www.ncbi.nlm.nih.gov/pmc/articles/PMC4769723/ [Accessed 25 February 2019]

Lancet, J. (2010) Endometrial cancer detected with transvaginal ultrasound in postmenopausal women [online] Available from: https://www.healio.com/hematology-oncology/gynecologic-cancer/news/print/hemonc-today/%7B89b40202-1103-4cf7-b816-404bdc1968f1%7D/endometrial-cancer-detected-with-transvaginal-ultrasound-in-postmenopausal-women [Accessed 26 February 2019]

Mankad, K., Hoey E., Lakkaraju, A., and Bhuskute,N. (2011). MRI of the Whole Body. An Illustrated Guide to Common Pathologies. London: Hodder Arnold

Meissnitzer,M., Forrstner, R. (2016) MRI of endometrim cancer – how we do it [Online] Available from: https://cancerimagingjournal.biomedcentral.com/articles/10.1186/s40644-016-0069-1 [Accessed 2 March 2019]

Nalaboff, K., Pellerito, E. (2001) Imaging the Endometrium: Disease and Normal Variants [online] Available from: https://www.vrad.com/reference-article/imaging-the-endometrium-disease-and-normal-variants/ [Accessed 2 March 2019]

Punwani, S., 2011. Contrast enhanced MR imaging of female pelvic cancers: established methods and emerging applications. European Journal of radiology [e-journal] 78, pp. 2-11. [Accessed 2 March 2019]

Rahmani, M., Heydari S., Mousavi, A., Ahmadineyad N., Azhdeh, S., Shakiba, M. (2018) Accuracy of Imaging in Preoperative Local Staging of Endometrial Cancer: Could Imaging Predict Low Risk Patients? International JournL OF Women’s Health and reproduction Sciences. Pp 363-368 [online] [Accessed 2 March 2019]

Rockall, A., Sohaib A., Sala E. (2014) Endometrial Cancer. Recommendations for cross-sectional imaging in cancer management. Second edition. London: The Royal College of Radiologists. [online] [Accessed 2 March 2019]

Waugh, A. and Grant, A., 2006. Ross and Wilson. Anatomy and physiology in health and illness. 10th ed. Edinburgh: Churchill Livingstone Elsevier.

Xu, X., Li, N., Chen, Y., Ouyang H., Zhao X., Zhou, J. (2018) Diagnostic efficacy of MRI for pre-operative assessment of ovarian malignancy in endometrial carcinoma: A decision tree analysis. Magnetic Resonance Imaging [online] Volume 57, pp.285-292. [Accessed 25 February 2019]


Role of MRI in Diagnostic Imaging of Scaphoid Fractures

MRI in diagnosis of Scaphoid Fractures

Scaphoid fractures usually happen after falling onto an outstretched hand (FOOSH) with the body weight landing on the palm. It is the most frequently fractured carpal bone, which is near the base of the thumb.

It is second most common wrist fracture after distal radius fractures. It can be hard to identify and treat, so prompt diagnosis and care is important. Scaphoid is considered to be the most vulnerable carpal with complex recovery following fracture (Mankad et al., 2011).  According to Geijer (2013), complications of avascular necrosis in proximal part of scaphoid develops due to interrupted blood supply originating from radial artery which enters the bone distally due to fracture.

Complications when not diagnosed or not appropriately managed could lead to non-union of the bone failing to heal properly. Symptoms of this is pain at the base of the thumb and swelling.

The wrist consists of eight small bones arranged in two irregular rows of four bones each. They are bound together by ligaments. These bones are the : Trapezium, Trapezoid, Capitate, Hamate, Scaphoid, Lunate, Triquetrum and Pisiform.

Various imaging modality to achieve earlier definitive diagnosis for suspected scaphoid fracture includes bone scintigraphy, MRI, CT, plain radiography, high frequency sonography.

Plain radiography.          

Some fractures are radiographically occult. It could take up to six weeks for scaphoid fractures to be conclusive on plain radiography. If no fracture is seen, patients are treated with cast immobilization followed by repeat x-ray and clinical examination.

As the prevalence of true fractures among patients with suspected scaphoid fractures might be only 5% to 10%, the majority of the patients are overtreated, which results in lost work days and productivity and increased healthcare costs (Yin, Z. et al., 2009).

In this case, to avoid undertreatment or overtreatment, and to achieve accurate early diagnosis to confirm scaphoid fracture, various imaging modalities are recommended to give more definitive diagnosis including bone scintigraphy, MRI, CT, high frequency sonography.

Bone Scintigraphy.

A bone scan or bone scintigraphy is a nuclear medicine imaging of the bone. Its advantage is having high sensitivity in the assessment of acute scaphoid fractures. A negative result in the bone scan rules out a scaphoid fracture. However, in the review of Michael Smith et al., (2009), when compared with other imaging modalities, it has a high false positive rate and a low specificity due to increased uptake from other traumatic conditions such as scapholunate instability, bone bruises, synovitis and arthritis.

Computed Tomography.

Computed Tomography has increased sensitivity and specificity in comparison to plain film in detecting occult scaphoid fractures. However, it is more expensive and associated with higher radiation dose (N. Compton et al., 2016)

Cone Beam Computed Tomography is a low dose technique used for extremity examination. In the study to identify the sensitivity of Cone Beam CT by Edlund et al., (2016) it was concluded that CBCT is a superior alternative to radiography, giving more accurate diagnosis of carpal region fractures. However, CBCT cannot be used to exclude scaphoid fractures, since MRI identified additional occult scaphoid fractures.

Although more superior, waiting time could be longer than having a plain radiography procedure.

Magnetic Resonance Imaging

MRI is an essential imaging modality in diagnosis of occult fractures of carpal bones, avascular necrosis, traumatic injuries of tendon and ligaments around wrist joint and infections (Saupe et al., 2005)

Paint Wrist

Fig 1. This T1 weighted image demonstrate the anatomy of the wrist joint in coronal plane. Image taken using Siemens Aera 1.5 Tesla with dedicated wrist coil.

In order to obtain this image (Fig. 1), patient was positioned prone, head first, with arm fully extended above the head – Superman position. This position allows to place the imaging anatomy as close to the magnetic field isocentre as possible which in turn results in higher SNR, reduced scan time and decreased possibility of aliasing artefact (Thomas et al., 2014).  Obtained image indeed demonstrates high SNR and optimal spatial resolution.  However, according to Potter, Schachar and Jawetz (2009), Superman position increase pressure on brachial plexus, therefore patient can be uncomfortable and potentially cause movement, thus method of positioning should be chosen and decided on individual basis.

In the meta analysis of Yin, Z. et al., (2009), MRI and CT showed higher specificity but Bone Scintigraphy was comparable in sensitivity but has lower specificity.

Imaging Modality Sensitivity Specificity Number of studies
Bone Scintigraphy 97% 89% 15
MRI 96% 99% 10
CT 93% 99% 6

Table 1. Comparison of Sensitivity and Specificity. Source: Yin, Z., et al (2009), Diagnosing Scaphoid Fractures.

Based on this evidence, they have concluded that MRI is highly accurate for confirming and excluding the diagnosis of scaphoid fractures and might be used ad the first choice in a patient with suspected scaphoid fracture. Bone scintigraphy is inappropriate for confirming scaphoid fractures. And that more studies are needed to assess diagnostic performance of CT to compare with MR and Bone Scintigraphy.

Mallee,W et al.,(2011) compared CT and MRI for diagnosis of Suspected scaphoid fractures

Modality Fracture Demonstrated in patient False Positive False Negative True Positive Sensitivity Specificity
CT 5 (15%) 1 2 4 67% 89%
MR 7 (21%) 3 2 4 67% 96%

Table 2. Comparison of CT and MRI results. Source: Mallee,W et al.,(2011) Comparison of CT and MRI for Diagnosis of Suspected Scaphoid Fractures.

It states that according to the McNemar test for binary data, these differences were not significant. Using Bayes formula, the positive predictive value was 0.76 for CT and 0.54 for MR. The negative predictive value was 0.94 for CT and 0.93 for MRI.

One difficulty that they have encountered on their study of suspected fracture is the absence of a consensus reference standard for a true fracture. While both MR (possible bone bruising) and CT (possible vascular channel) may have findings that can be misinterpreted as fracture, it is not clear that a six week post injury radiograph can be used to diagnose all fractures. In their study, one evident fracture was diagnosed in CT and MR but was not seen on the six week scaphoid series.

CT has increased sensitivity and specificity compared to plain film in detecting occult scaphoid fractures. However, it is more expensive and uses higher radiation dose. MRI has been shown in several studies to be most effective in detection of scaphoid fractures. In the study of Dorsay et al., (2001) it showed that MRI after plain radiography is more cost effective method for ruling out occult fractures.

Cost Radiation Dose OPD waiting time Duration (Minutes)
Plain radiograph 50 0.96 mGy Immediate <2
CT 190 19.8 mGy 6-12 months 5-15
MR 250 Nil 6-18 months 15-25

Table 3. Comparison of Plain radiograph, CT and MRI in terms of cost, radiation dose, waiting time for appointment and duration of scan time. Source: N. Compton et al., (2016) Tomosynthesis: A radiologic technique for rapid diagnosis of scaphoid fractures.

This table from the journal written by N. Compton (2016) shows that the plain radiograph is much cheaper and quicker to obtain compared to other imaging modality. However, in the review of Michael Smith et al., (2009) while plain radiography is accepted as the initial modality for suspected fracture, repeat radiographic examination is needed when initial radiographs are negative but there is a persisting clinical suspicion. This will support the review of Yin, Zhong-Gang et al., (2009) that due to some fractures being radiography occult in initial radiograph, majority of patients are overtreated in terms of repeat clinical examinations and radiographs, which results in increased healthcare cost.

Conclusion

Early diagnosis and treatment for scaphoid fracture are critical to improving outcome. MRI has been shown to high sensitivity and specificity when diagnosing scaphoid fractures.  MRI comparing to initial negative plain radiographs demonstrated cost effectiveness compared to unnecessary immobilization and repeated patient assessment and radiographs. It allows the diagnosis of occult bony and soft tissue injuries that can present clinically as a scaphoid fracture.

The National Institute for Health and Care Excellence (NICE) recommends to consider MRI for first‑line imaging in people with suspected scaphoid fractures following a thorough clinical examination in their guideline in 2016.

However, as MRI waiting time can be a significant problem, alternative imaging modality can help. Patients with contraindications will hinder them having MRI examination. CT with reconstruction made in planes defined to the long axis of the scaphoid is comparable with MRI in diagnosis of suspected scaphoid fracture. CT can provide high resolution imaging however its sensitivity is not as high as MR and use radiation.

References

Mallee, W., Doornberg, J.N., Ring D., Van Dijk, C.N., Maas, M. and Gosling J.C. (2011) Comparison of CT and MRI for Diagnosis of Suspected Scaphoid Fractures. The Journal of Bone and Joint Surgery. Available from: https://journals.lww.com/jbjsjournal/Abstract/2011/01050/Comparison_of_CT_and_MRI_for_Diagnosis_of.4.aspx  [Accessed 12 February 2019]

Smith, M., Bain, G., Turner, P. and Watts, A. (2009) Review of Imaging of Scaphoid Fractures. [Online] Available from: https://onlinelibrary.wiley.com/doi/abs/10.1111/j.1445-2197.2009.05204.x [Accessed 10 February 2019]

Yin, Z., Zhang, J., Kan, S. and Wang X. (2009) Diagnosing Suspected Scaphoid Fractures. A Systematic Review and Meta-analysis. Available from: https://www.ncbi.nlm.nih.gov/pubmed/19756904 [Accessed 10 February 2019]

Compton, N., Murphy, L., Lyons, F., MacMahon P. and Cashman, J. (2016) Tomosynthesis: A new radiologic technique for rapid diagnosis of scaphoid fractures. [Online] Available from: https://www.sciencedirect.com/science/article/pii/S1479666X16301652 [Accessed 10 February 2019]

National Institute for Health and Care Excellence (2016) Fractures (non-complex) : assessment and management. Available from: https://www.nice.org.uk/guidance/ng38/chapter/Recommendations#acute-stage-assessment-and-diagnostic-imaging [Accessed 12 February 2019]

Edlund, R., Skorpil, M. and Lapidus G. (2016) Cone-Beam CT in diagnosis of scaphoid fractures. Available from: http://dx.doi.org/10.1007/s00256-015-2290-6 [Accessed 12 February 2019]

Geijer, M. (2013) Diagnosis of Scaphoid fracture: Optimal Imaging Techniques. Reports in Medical Imaging. [Online] Available from: http://citeseerx.ist.psu.edu/viewdoc/download?doi=10.1.1.887.3962&rep=rep1&type=pdf [Accessed 12 February 2019]

Mankad, K., Hoey, E. Lakkaraju, A., and Bhuskute, N. (2011). MRI of the Whole Body. An Illustrated Guide to Common Pathologies. London: Hodder Arnold


Liver Metastases

Diagnosis of Liver Metastases

Liver is the largest organ inside our body. It is one of the most common site of metastatic spread of epithelial cancers, secondary to regional lymph nodes.

Liver Metastasis are most common malignant liver lesion. Cancer in the liver is mostly secondary and they mainly arise from cancers in the gastrointestinal tract, kidneys, breast, colon, rectum, pancreas and lung. Liver metastasis can still occur in later years after the primary cancer has been removed. Some of the symptoms of patients with liver metastasis could be loss of appetite, weight loss, abdominal swelling, jaundice, pain in the upper right side of the abdomen.

Liver metastases can be diagnosed with imaging modalities like Ultrasound, Computed Tomography, Magnetic Resonance Imaging among others.

Ultrasound is dependent on both patient and operator. With the consideration of the patient’s habitus and the operator requires skill and knowledge. The development of Ultrasound contrast agent increased the ability of sonography in the assessment of focal liver lesions. Ultrasound contrast agent that is available include Sonovue (Bracco).

According to Dr Martin Czarniecki et al, contrast enhanced ultrasound has the advantage over contrast enhanced MRI and CT in patients with contraindications such as renal failure or contrast allergy. Contrast enhanced ultrasound also allows dynamic and repeat examinations.

In the study of Vito Cantasini et al, the sensitivity of ultrasound in metastasis detection is reported in the literature as low and variable, ranging from 50% to 76%. But with the introduction of contrast enhanced ultrasound, the accuracy for liver metastases rates as high as 90% with both high sensitivity for detecting CRLM and high specificity for characterizing focal liver lesion.

J Ultrason on his article shows a table of characteristic of focal lesions in the liver in a contrast enhanced ultrasound examination of what clinician expects

Lesion Arterial phase Delayed phase
Cyst No enhancement No enhancement
Focal steatosis Enhancement identical to normal liver, no mass effect Enhancement identical to normal liver, no mass effect
Abscess Irregularly enhancing rim, no central enhancement Hypoechoic rim, no central enhancement
Angioma Peripheral to central enhancement, frequently nodular Iso- or hyperechoic peripheral enhancement, the entire lesion can be enhanced
FNH Spoke-wheel enhancement Isoechogenicity
Adenoma Central enhancement Isoechogenicity
Vascularized metastases Uniform enhancement Hypoechogenicity
Non-vascularized metastases Peripheral enhancement Hypoechogenicity
HCC Strong enhancement Hypoechogenicity/ sometimes isoechogenicity

In the article of Ali Nawaz Khan, Computed Tomography is the imaging modality of choice for evaluating liver metastases. This preference is referable to the effects of the dual blood supply on the enhancement characteristics of metastases, as compared with normal liver parenchyma.

In the review of Gregory T. Sica et al, the reported overall sensitivity for portal venous phase scanning is 91% for detection of malignant tumours greater than 1 cm but a sensitivity of 56% for lesions smaller than 1 cm.

The imaging appearance of most metastases masses on Computed Tomography are low or iso attenuated. Depending on the lesion size, irregular margins and necrosis may be present. Most metastases are hypo vascular and on arterial phase, it would show a complete ring of enhancement.

MR gives better soft tissue contrast. Two type of MR contrast agent are the non specific gadolinium chelates and the liver specific MR contrast agent that is targeted toward hepatocytes and provide either positive or negative enhancement after intravenous administration.

Due to high specificity of and no radiation exposure, MR is the imaging modality of choice for detection and characterization of liver lesion. Most metastases are hypo to isointense on T1 and iso to hyperintense on T2 weighted images. The contrast agent provide tumour characterization and can be safely used with patients with iodine contrast allergy.

The study of S Blyth et al shows the sensitivity of MR with regards to the diameter of the metastases.

Diameter of metastases (mm) No. detected by MRI (true positive) No missed by MRI (false negative) Sensitivity of MRI according to diameter of metastases
0–10 6 5 55%
11–20 27 0 100%
21–30 20 0 100%

A meta analysis conducted shows that Sensitivity and specificity on per patient basis for US, CT and MR were 63.0% and 97.6%, 74.8% and 95.6%, 81.1% and 97.2% respectively. On per lesion basis, sensitivity was 86.3%, 82.6% and 86.3% respectively. MR showed a better sensitivity than of CT. (Floriani I et al. 2010)

According to Ali Nawaz Khan et al, MR may be superior to multidetector CT for detection and characterization of small lesions and to evaluate the liver with background fatty liver changes.

Although MR appears superior with imaging Liver metastases, there are also of factors to consider when choosing the modality to use. Some of them are patience tolerance, clinical skill, availability and cost. The Conventional ultrasound used to be inferior to Computed Tomography and Magnetic Resonance Imaging due to lack of contrast agent but has changed since the introduction of the microbubble contrast agent for Ultrasound, but with disadvantage when there is lack of skill of operator. MRI could have a disadvantage with patients who are claustrophobic, unable to hold breath during sequences, non conditional metallic implants especially non conditional pacemakers. Computed Tomography involves radiation. CT and MRI contrast agents could be a contraindication depending on patient’s kidney function or eGFR, and any risk of allergic reaction.

In summary, as the evidence shows that MRI has higher sensitivity and specificity compared to the modalities above, it should be used as the primary imaging modality for detection of liver metastases for the patients that are suspected of.


References:

  1. Floriani I, J (2010) Performance of Imaging modalities in diagnosis of liver metastases from colorectal cancer: a systematic review and meta analysis Magn Reson Imaging, Milan, Italy
  2. S Blyth, A Balkeborough and AW Majeed (2008) Sensitivity of Magnetic Resonance Imanging in the Detection of Colorectal Liver metastases, Sheffield UK
  3. Ali Nawaz Khan, Ajay Pankhania, John Kerani (2015) Liver Metastases Imaging, Manchester UK
  4. Vito Cantisani, Hektor Grazhdani, Ferdinando D’Amrosio (2014) Liver Metastases: contrast enhanced ultrasound compared with computed tomography and magnetic resonance, Rome Italy, Baishideng Publishing Group
  5. Dr. Marcin Czarnieki , Contrast Enhanced Ultrasound, Radiopaedia
  6. J Ultrason (2015) Ultrasound imaging of the liver and bile ducts – expectations of a clinician, Poland, Medical Communications Sp
  7. Gregory T. Sica, Hoon Ji, Pablo R. Ros CT and MR Imaging of Hepatic Metastases Boston MA

This Is Me..

My name is Cynthia. My friends call me CK. I was born in Manila, Philippines.

I didn’t know what course to take or what I wanted to be after secondary school, so I took up the course Physical Therapy as my mom advised, because at that time the profession was high in demand. I studied that for two years, but I felt that it really wasn’t for me. I tried to shift into Accounting but the subjects I have already taken was mostly irrelevant to them so I was not accepted and so I ended up in the college of Medical Radiation Technology. In Philippines, Radiography course takes four years, three years of academic lessons and one whole year of internship. Same year when I started radiologic technology, my brother finished on the same course. We both graduated from De La Salle University Dasmarinas, which in the beginning, it was the only school accredited by HCPC, and then the other schools applied as well for the accreditation.

After graduation in 2001, my first job was as a Mammographer in Makati Medical Center, Philippines.  I did that for three years. My brother is already working in Coventry, West Midlands and he kept on telling me to apply here in United Kingdom.  There were a lot of agencies that time in Manila to get a job here in the UK, but I was told that the HCPC register might deny my application  because my work experience was only in mammography and nothing in general radiography  and experience during internship will not count.

In 2004, I applied in Singapore, and I worked there for six years.  I started with doing general radiography and after six months, I was trained to do Computed Tomography and a year later, I was trained to do MRI. The MR machine I used there was GE and a Siemens 3T. We do on call MRI shifts and perform various types of examinations. Singapore is a beautiful country. Working there was really a good experience. I worked in Tan Tock Seng Hospital, they are always very cautious of infection control after the SARS (Severe acute respiratory syndrome) outbreak in 2003 when a lot of people were affected and for a time, Singapore was like a ghost town. Tan Tock Seng was designated the SARS hospital. I felt I was lucky to join them when Singapore was already SARS free but feels sad with all the stories from the experience of my colleagues, when some of them were quarantined, and some could not go home to their families and needed to stay in the hospital. You can check the story online and the time line  from https://straitstimes.com/singapore/sars-in-singapore-timeline. So while I was working there, every time there was a suspected flu outbreak,  our temperature was being taken twice a day, working or not, we need to submit the reading. We were constantly checked on how to do proper PPE and we need to be able to demonstrate the proper use of it  like which one to put on first and which one to take out last when finished.

I started my family there in Singapore. I got married and there I gave birth to my one and only son. After working there for six years, I started to apply for a job here in the UK.

I have been working as a Senior MRI Radiographer with InHealth since 2010.  I started in mobiles London and Southeast.  They always send me to work in Eastbourne, and I really love the place and I thought it would be better to work in a static unit for my family, so when they had an opening, I applied and I have been working in Eastbourne since 2011. I also wanted to do more complex cases and in the mobiles, we are limited with what we can scan, so I am really pleased to work here in Eastbourne where we perform different types of contrast enhanced scans including Angiography, Whole body, Breast scan, Multiparametric prostate, Small bowel and Paediatric or Adult examinations under General Anaesthetic.

I really wanted to do this post graduate study and I am going to try to do my best in this.

We recently bought a house and my hobbies now includes looking on websites for home improvements. We like to watch movies, eat and travel and have been on some European countries. And because I love watching Korean series, I hope to travel with my family to Korea and Japan. When we can, we visit my brothers family in Coventry or vice versa.

Here’s a photo of us when they visited last Christmas on our new home.


img_5384

So this is something about me… Thanks for reading 🙂